Dhurandhar Movie: FanPulse Insights Dashboard (Real-Time Sentiment & Trend Analysis)
An AI-powered dashboard to analyze conversations, sentiment, and trends around Dhurandhar across platforms. Transforms scattered social signals into insights.
- what signals to track
- how to structure insights
- how to surface meaningful patterns
The dashboard highlights dynamic shifts such as trending characters, sentiment changes, and viral meme discovery.
Example:
The most discussed character changed 3 times within 24 hours, and key memes were surfaced on the dashboard before being noticed manually across platforms.
This project is part of a broader approach to use AI as a thinking partner to transform messy data into decision-ready insights for businesses. - Model
- Unknown monetization
Added May 30, 2026
https://dhurandharpart2insights.lovable.app/An AI-powered insights dashboard built to analyze real-time conversations around the movie Dhurandhar across multiple platforms.
The goal was to convert scattered social media signals—memes, reactions, reviews, and sentiment—into a structured, easy-to-understand view.
This was not generated with a single prompt. It involved multiple iterations to define:
Built with
 Lovable
At a glance
More Analytics Dashboard examples built with Lovable.
Ready to build something amazing?
Start creating your own project with lovable.dev — the platform that makes web development simple and enjoyable.
Get started now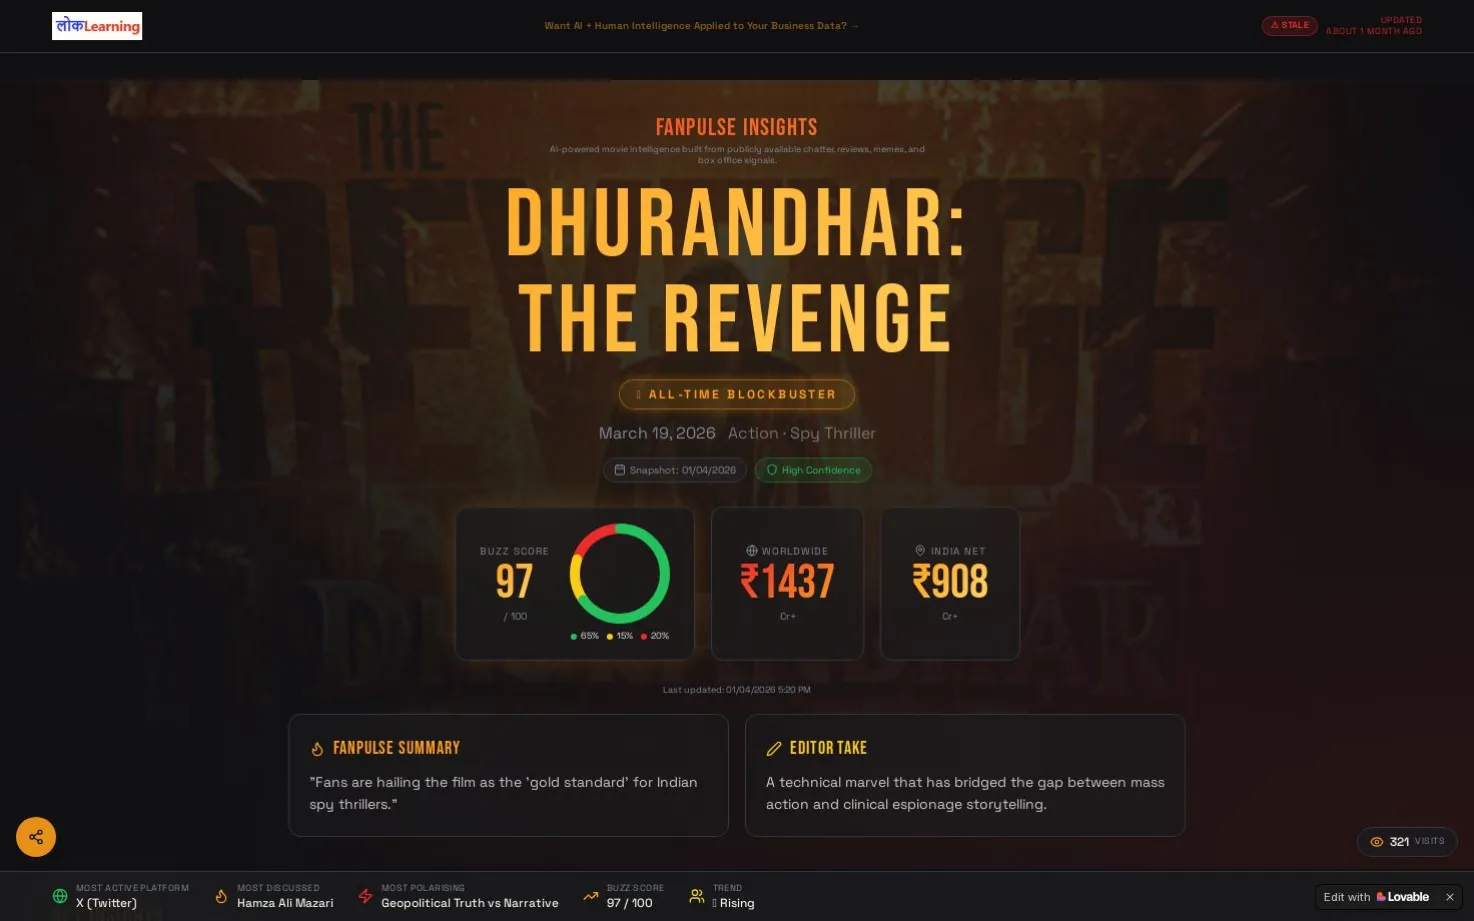
About this project
- Target audience
- Movie marketers, social media analysts, fan engagement teams, and businesses interested in real-time insights on movie-related conversations and trends.
Problem solved
Scattered social media signals about the Dhurandhar movie are hard to track and analyze manually, making it difficult to understand fan sentiment and trending topics quickly.
Key features
- Real-time tracking of fan conversations and sentiment across multiple platforms
- Identification of trending characters and viral memes
- Visualization of dynamic shifts in sentiment and discussion topics
- Aggregation of diverse social signals like memes, reactions, and reviews into structured insights